Understanding HMRC’s Latest R&D Tax Credit Statistics
In this article we provide a summary of everything you need to know from HMRC’s latest R&D tax credit statistics and what this might mean for the future of schemes. In this article, we consolidate data from both the SME and RDEC schemes. As of 1 April 2024, the two schemes have been combined into a new merged scheme.
Data for the 2022-23 tax year will be released in September 2024.
Insights into statistics – September 2023
The estimated number of claims made for the year ended 31 March 2022 was 90,315, an increase of 5% from the previous year. As we saw with 2020-21, in comparison to other years, growth in the volume of claims is continuing to slow down. From a value perspective, however, we see a slightly different story, with an estimated value of £7.6bn, the value of R&D relief claims has increased by 11% on last year’s £6.8bn. It is also marks an increase of 10% compared to the previously highest year 2019-20.
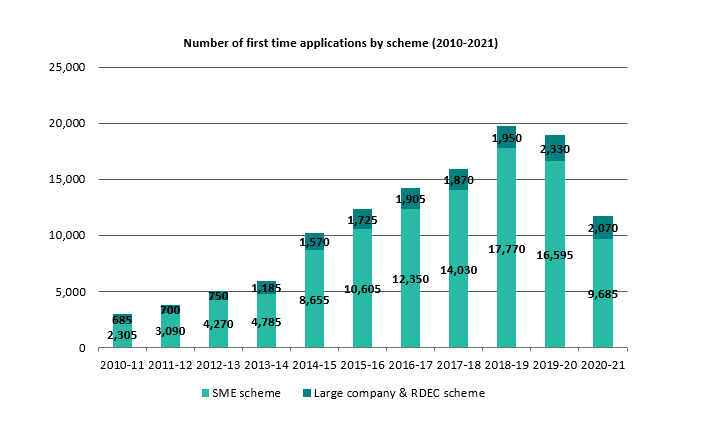
Moving on to the provisional industry data, as with previous years, Information & Communication, Manufacturing and Professional, Scientific & Technical are the sectors with the highest concentration of claims (23%, 23%, and 16% respectively), with them also accounting for 23%, 23% and 21% of the total amount claimed respectively. As with the regional data, most sectors saw an increase in value, with the exception of Financial & Insurance and Mining & Quarrying, sectors that both experienced a decrease. Arts, Entertainment & Recreation, Water, Sewerage and Waste, Real Estate, and Public Admin, Defence & Social Services sectors all remained flat in both volume and value.Finally, we look at how the number of new claimants has evolved over recent years, as this provides a useful indicator for the level of new innovation or new entrants across the UK market. The updated figures for 2020/21, displayed in the chart below, show that after the success of both schemes steadily improving over the last decade, they appear to be levelling off. As with the initial figures for 2020/21, while it looks like there was a significant drop off in 2021/22 figures, businesses have until March 2024 to file claims for this period, so we may see that gap shrink once the final statistics are available later this year. At this point, we will be able to see if the numbers will continue to remain stable, or if this figure for 2020/21 is a by-product of the COVID-19 pandemic.
HMRC have previously released national statistics providing information on the number of companies claiming Research and Development (R&D) tax credits and its associated cost to the Exchequer for claims up to the year ending 31 March 2021. We have summarised below the key takeaways from the data.
Insights into statistics – September 2022
R&D tax relief remains a key form of tax relief available to innovative companies. The estimated number of claims made for the year ended 31 March 2021 was 89,300, an increase of 7% from the previous year. Despite the increase, this is a notable slow-down in growth compared to previous years. If we tie in the fact that total value of R&D tax relief claimed for the year is estimated at £6.6billion, 4.4% lower than 2019/20 figures and an 11% reduction in R&D expenditure, we are likely starting to see the global interruption to innovation for businesses during the COVID-19 pandemic.
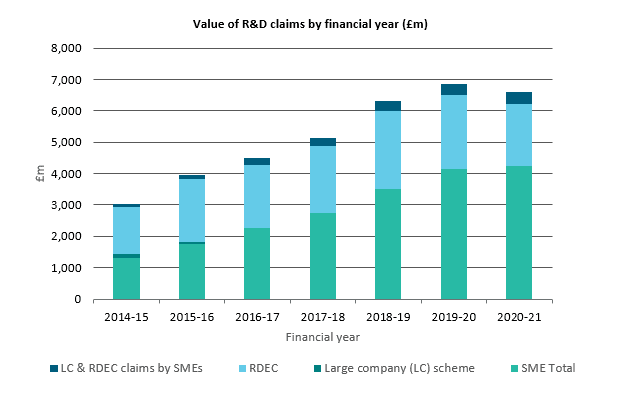
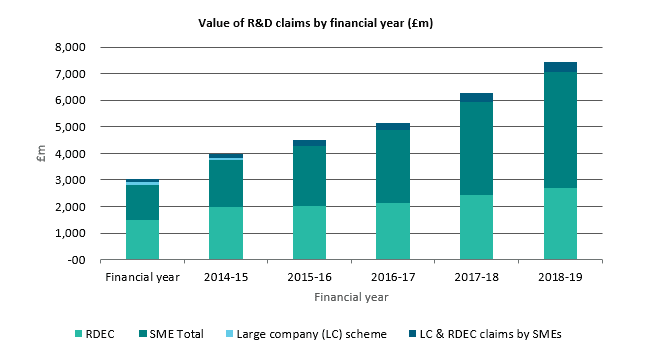
Chart showing total support claimed through R&D tax credits by scheme (£m) for periods 2014-15 to 2020-21
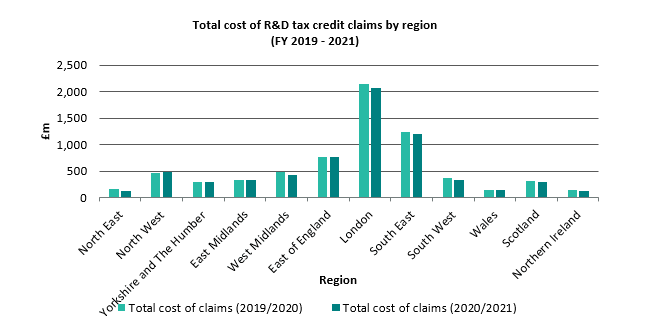
As may be expected, the highest concentration of claims by number and claim value is once again within the London region, as shown through claim numbers rising by 8.7% from 2019/20 to 2020/21. However, the cost of claims fell in line with overall regional figures, at 4% during the same period. Estimations for 2020/21 suggest that the North East, reaching into Yorkshire and the Humber, and the East of England are becoming innovation hubs with growth rates experienced in the last 12 months at between 9-10% in those regions. Interestingly, while the value of R&D claims across the board appears to be reduced in the 2020/21 figures, the North West of the UK is showing to be bucking this trend, with growth of 5.6% in the value of an average claim.
Gemma Thake, Tax Director, commented “HMRC’s latest statistics show that 49% of the total amount of R&D tax relief claimed nationally is concentrated within claims made by businesses located in London and the South East. There is a significant disparity in the amounts claimed by region and it will be interesting to see how HMRC target both the innovation hubs as well as areas where there are currently a relatively low number of claims made.”
Looking to the provisional industry data, HMRC statistics indicate a further consolidation in those key sectors mentioned above, with growth rates in the number of claims for Information & Communication, Professional, Scientific & Technical, and Manufacturing experiencing expected growth of 14%, 9% and 16% respectively. As with the overall data, the value decreased across these and many other sectors, perhaps indicating a scaling back of R&D expenditure during the uncertainty of the pandemic.
Finally, we turn our attention to how the number of new claimants has evolved over recent years, as this provides a useful indicator for the level of new innovation or new entrants across the UK market. From the chart below, we can see that the success of both schemes has been steadily improving over the last decade. Currently, it looks like there was a significant drop off in 2020/21 figures, but given that businesses have until March 2023 to file claims for this period, we may see that gap shrink by the time the final statistics are available. Nevertheless, if there is a notable reduction in new entrants during the COVID-19 period, it would be interesting to observe what steps, if any, are taken to encourage businesses back to the scheme as the UK looks to recover.
Insights into statistics - September 2021
The total number of claims for the year ended 31 March 2020 increased 16% from the previous year, to a total of 85,900 claims. In line with previous years, this growth has been driven predominantly by the increased usage of the SME scheme. However, it is not just the number of claims that has increased at a strong rate during 2019/20, the value of claims has surged slightly more, with an increase of 19% from £6.3bn to £7.4bn.
The extent of investment in innovation in the UK is not to be underplayed as a total claim value of £7.4bn, represents actual investment in R&D by UK tax-paying businesses of £47.5bn, according to HMRC. This figure has been steadily increasing since the R&D tax relief was introduced. SMEs represent a significant and majority proportion of claimants, evidencing the success of the SME scheme and renewing the Government’s support for driving business innovation. Between 2010/2011 and 2018/19 the number of first-time applications for the SME scheme has increased by 670%.
When we look at the regional distribution of R&D claims, analysed by registered office location, we can see that there is still a significant concentration of claims in London and the South East with the two regions accounting for 49% of the value of claims. However, it is worth noting that the categorisation by businesses’ registered office may provide a misleading outlook of the spread of innovation across the UK, something that may be particularly interesting to consider when we turn to looking at the 2020/21 estimated figures as it is the first data that covers the COVID-19 period, during which anecdotal evidence suggests that a number of businesses looked to move operations outside of London.
There is equally concentration of R&D around a few key sectors, namely Manufacturing, Information & Communication, Professional, Scientific & Technical across both the value (69% collectively) and volume (63%) of claims during 2019/20, based on SIC code classifications. These figures are perhaps unsurprising given that innovation is a key value driver in each of these industries, but the dominance across the 12 months to March 2020 is interesting to observe.
HMRC attempt to remove non-compliance
One other significant focus in the periods 2019/20 and 2020/21 is an increased increase by HMRC on removing non-compliance across the schemes. Given the generosity and extent of the relief, it is perhaps unsurprising that HMRC are taking an increased interest in the rise of potentially fraudulent claims. We are now used to seeing standard letters from HMRC to first time claimants following submission of their claim, recommending that they check their claims submitted are correct and optimistically provide instructions for amending your return if, upon review, you conclude the claim does not qualify.
If you have received one of these letters and are unsure of how to respond or if you would like our tax specialists to review your claim before submitting to HMRC, please contact our team using the form below.
We always recommend that you seek advice from a suitably qualified adviser before taking any action. The information in this article only serves as a guide and no responsibility for loss occasioned by any person acting or refraining from action as a result of this material can be accepted by the authors or the firm.
Have a question about this article? Ask our team...
We can help
Contact us today to find out more about how we can help you